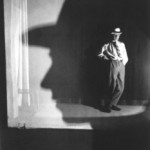
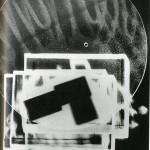
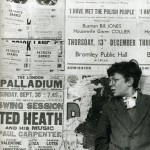
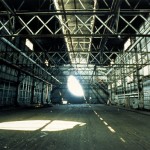
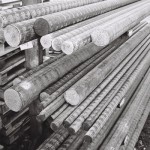
I took these photos around bath, then developed the film in the darkroom.

I took these photos around bath, then developed the film in the darkroom.
I took these photos around bath, then developed the film in the darkroom.

Artist Research


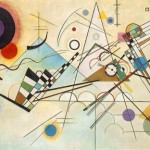


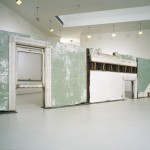
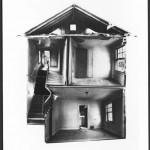
Gordon Matta-Clark “is famous for his “building cuts,” a series of works in abandoned buildings in which he variously removed sections of floors, ceilings, and walls.”


DAYTRIPPER
Response to London field trip.
Compile 6 drawings or handmade designs inspired by the exhibition of your choice. This should be in the spirit of research and exploration rather than ‘finished’ pieces. Take items and details from things you have seen. Study and develop (you may wish to change, add, mix, subtract). Take your pieces in any direction that suits you. If you wish to approach this as a straightforward drawing exercise then this is ok too but you should attempt to develop and experiment with your drawings. Keep a uniform format throughout (A4 portrait or square for example). You should write a brief written explanation of the source material and what interested you about it, this can be quite informal. If you were unable to attend the London visit then you should find a museum or exhibition in Bath or Bristol.
Please note this will be a listed project for assessment. additional resources research from review
week London project or equivalent
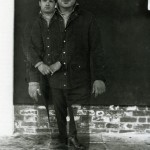
I took these photos using a digital camera.

.

.

.


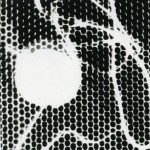
Initial clips – flash/reflective fabric
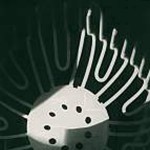
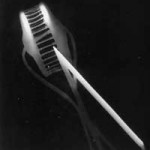
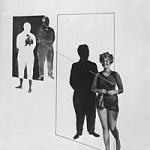
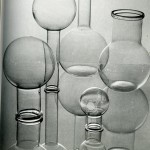
I started by looking into the darkroom process of light/exposure. I hired a big flash gun, stobe lighting and a red gel and started experimenting.
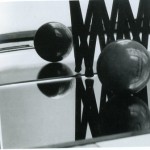
This clip shows the effect of a flash gun on film capturing.The effect is white strikes across the screen.
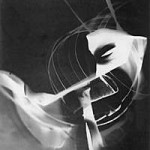
I wanted to see the effect of a flash gun on reflective fabric, but the results didn’t really work how I expected. However I did achieve a nice effect with transition of lighting/gels . See the 2 clips below:
I really like the red to white transition from this clip
My inital idea was show the process of the darkroom, apply this to a font without using a darkroom.
The satges are
expose – light
develop – chemical
stop – chemical
fix – chemical
wash – water
Therefore my font would change in response to these stages.


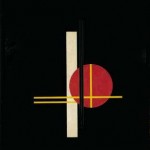
I went to an talk by Why Not Assiotiates to give me some inspiration.

I especially liked this.


BRIEF: 4D TYPOGRAPHY
Develop a prototype/demo for a typeface that transforms over time, (Examples: an emailfont that deteriorates as incoming messages expire; a font made from clear gel and mold that ‘grows’ into a time-sensitive message). Any means conceivable can be used to create the typeface (animation, photography, programming, sculpture, video, etc.) as long as the letterforms transform over time and the final output is projected or presented on-screen.
Conditions
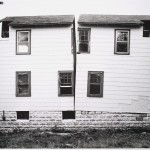
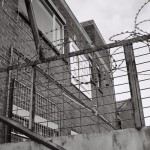
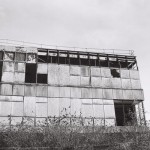
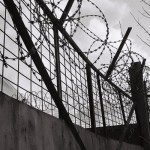
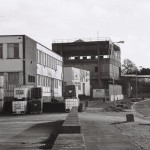
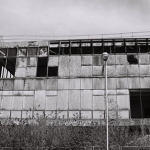
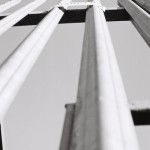
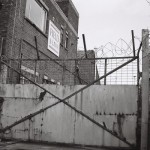
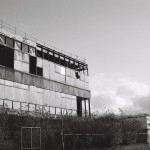
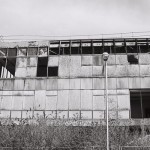
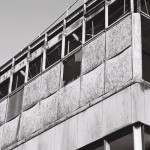
To take pictures of disused/derelict buildings/places and create pieces of work that reveal their hidden history/use.
Bath Gasometers – pipe network (418 bus)
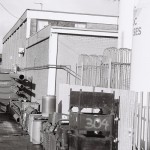
Bath printing press – book printing, letterpress, (number 5 bus)
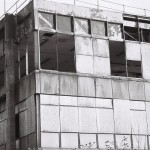
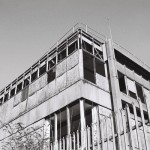
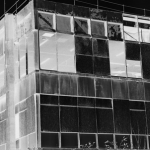
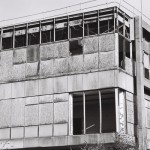
Co-op society building (number 10 bus)
I will to add to this list as I travel round bath more.
Find out history, use of these buildings, take photos
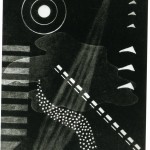
Image created by printing out lots of thin lines of colour, scanning the printed image than zooming into the lines.

Pixel colour


Photos by Megan Ruth Jack
The mayor who brought colour to Albania
by Jacky Rowland, BBC correspondent in Tirana
Albania was once the most isolated country in Europe and its capital, Tirana, was blighted by socialist architecture and decaying infrastructure.
After the fall of Communism, there was a free-for-all. New buildings went up in an unchecked manner but no-one bothered to fix the roads, the power cables and the sewage system.
Now, however, Tirana has had a facelift.
The new Mayor, Edi Rama, was first elected into office in 2000 and has cleaned up scruffy avenues and repaired roads and public buildings. But the mayor’s unconventional approach and his strong personality have ruffled more than a few feathers.
Mr Rama is a former artist, basketball player and culture minister.
He is a big man with big ideas, and has made colour his trademark: paintbrush-wielding teams have turned grim concrete facades into a blaze of colour and abstract designs.

“I’m not sure I am a politician,” the mayor told me, standing on a balcony overlooking the main square of Tirana. “I would say that I am still an artist and I’m trying to use politics as an instrument for change.”
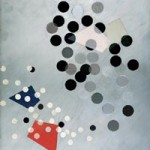
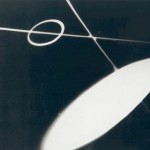
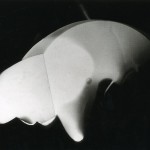
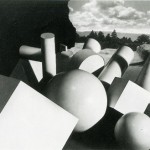
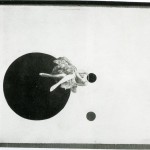
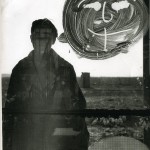
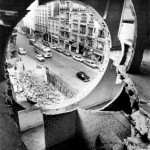
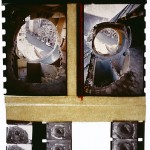
Images created using a digital camera. To create the white cloud effect I created a photogram of ice and layered it over the top.

.


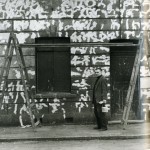
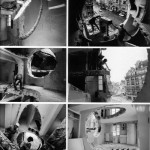
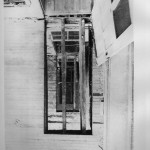
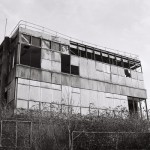
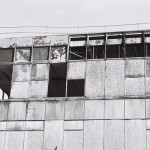
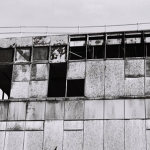
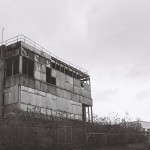
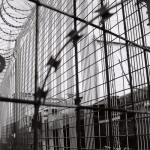
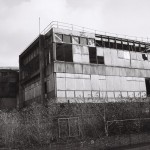
I’ve seen this building a lot and have always wanted to take a picture of it, I plan to develop some of these images myself using the darkroom, these are images I took of the building and other hidden places in bristol. I was quite fortunate with the weather as it had been drab all day.


What are maps?
The dictionary definition of a map is, “a representation, usually on a flat surface, as of the features of an area of the earth or a portion of the heavens, showing them in their respective forms, sizes, and relationships according to some convention of representation: a map of Canada.” Therefore maps represent areas, attributes and dimensions is a scale – usually smaller than lifesize. Maps help make understanding clear and lets us see beyond what our eyes are cable of seeing.
Anything can be mapped, and most things are: places, businesses, galaxies, histories, bodies, philosophies, devices and databases.
Maps outline territories from governments, Oil locations, Social scientists use maps to publiscise social problems.
They are seen by the reader as neutral information, however this is not always the case and therefore maps have a power that can persuade the reader without them realising. For example the map of the world is drawn pointing north and not south. This creates a hierarchy of the Earth.

The language of cartography is so ingrained that it has become invisible.
We do not question the orientation of the map of the world. An upside down map looks odd, it also give the southern hemisphere countries dominance over the northern ones.
Why use maps?
William Owen
Maps give their readers the simple and magical ability to see beyond the horizon. The enlightening and revelatory
characteristic of a good map derives from its encompassing vision, contained within a single consistent pictorial model. The map provides a view that slides instantaneously between panorama and detail. A map embodies the work, knowledge and intelligence of others. We obtain a vision of a place that we may never have seen, or divine a previously unseen pattern in things we thought we knew intimately. So, we ‘consult’ a map as we would an adviser in order to locate, identify and decide, or to be enlightened. As a result we suffer, sometimes, a grand illusion of omnipotence by believing that the map contains everything necessary for understanding or controlling a domain. We forget that the mapmaker has an implicit or explicit agenda of his own, not necessarily aligned with ours. Maps are imperfect They have missing layers and gaps within the layers (“London”, said its ‘biographer’ Peter Ackroyd, “is so large, and so diverse, that a thousand different maps or topographies have been drawn up in orderto to describe it”). Paradoxically, much infolillation can be gathered from the gaps left in maps, not least about the mapmaker’s intentions. This is one of the beauties of maps.

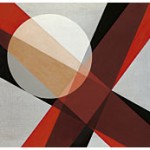
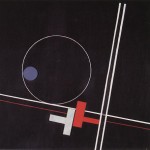
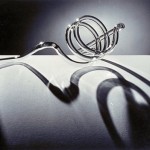
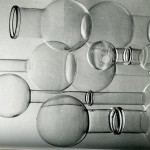
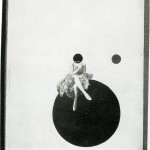
I found this image in “A book of curves” by E.H.Lockwood which reminded me of the image below ( a screen shot from stranger than fiction. The book is a mathematical book and shows the relationship between shapes, curves, aesthetics and mathematics.


Pipe network to be mapped in 3D
By Jonathan Amos, BBC News science reporter
The maze of pipes and cables that snake beneath the UK’s streets are to be mapped in a £2.2m pilot project. An intimate knowledge of this tubular underworld is expected to help reduce the number of holes that need to be dug by utilities, and cut traffic jams.
Nottingham and Leeds researchers will trial new 3D mapping technologies at half a dozen UK locations. It is thought there are enough pipes and cables below ground in Britain to stretch to the Moon and back 10 times. Some were laid more than 200 years ago and accurate information on their precise positions is often non-existent or sketchy at best. There are 30 to 40 incidents each year where workmen are seriously injured because they have accidentally sliced through electricity cables. “When utilities and highways authorities are digging in the street, they often find things they didn’t expect, or don’t find the things they were looking for,” explained Mike Farrimond, director of UK Water Industry Research Ltd, which is managing the mapping project. “If we had detailed 3D maps of what was down there, we’d be much more efficient at finding and fixing leaks, and connecting people to services.”

Schematic showing what lies under a west London street (Leeds) .The schematic diagram above shows the typical level of complexity of pipes and cables that exists under one London street.
In the UK there are: 275,000km of gas pipes; 353,000km of sewer pipes; 396,000km of water pipes; 482,000km of electricity cables.
A third of the pipes in London were laid more than 150 years ago; 20 cable firms have worked in London in the last five years. Camden High Street in London was dug up 144 times in one year; Glasgow’s Great Western Road, 223 times. “You can’t look at an Ordnance Survey map to find out what’s under the ground,” explained Tony Cohn, professor of automated reasoning at Leeds University.
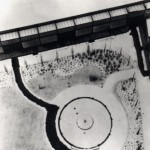
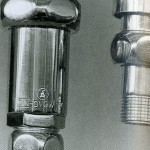
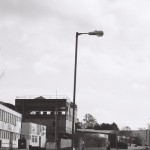
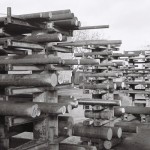
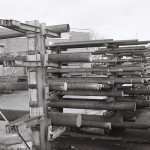
I was on the bus in town and noticed these big drum like structures – they are not hard to miss! At first I thought they where water towers,but after research and found out that they where gas storage tanks called a gasometer. Gasometers maintain the correct pressure – otherwise housing systems would not work.Store get gas at different pressures, lower pressure system. Comes into house.
In summer = high
In winter = they become low
Without gas meters all gas would go out.

Map showing gas pipe network from gasometers

OBESELETE SYSTEMS, now they have become an obeselete system.
Energy.
UK gas grid
British energy takeover edf.
Power stations.
Hickley point power station.
Snowdonian north wales dinorrig first hydro-electric.
Hidden energy systems
Information about a buildings and properties that are unseen and taken for granted.
Hidden information:
Stranger than Fiction Intro sequnce: In this video the audience is given information about the inner workings of hidden building structures, mechanisms, routines, inner thoughts and ideas of the mind, aswell as information about mundane things like number of steps to cross the road, or brush strokes. These pieces of information are usually hidden from the audence – but in these titles they are shown for storyline effect.
Hidden Mechanisms:
Hidden buildings/places:
Re format/organise the below document into an A2 poster:


HIDDEN
“You are asked to produce a piece of work in response to the above theme.
Themes that you may wish to explore may include concealment, camouflage, optical illusion, secrets, lies. The final outcome may be typographic, photographic, film, interactive, animation, illustration or 3-dimensional. Whatever works. Almost certainly you will need to conduct a lot of research in the form of investigation, trials and practical experiment. You should not concern yourself with a final outcome until you have conducted extensive open ended experiment. As part of this project you may wish to set up, or continue your current use of a blog. Use this blog as a research tool, post any of your work in progress (but not finished pieces), ask questions about your work so that others may help you with suggestions. You may also post examples of other work that you find inspiring or relevant but add a sentence or two about why you have chosen to post this item. A high level of research, which can be evidenced in your blog, and final out- come is expected.”
“In communication there’s an implicit interaction, the first piece of
information sets the context in which the next statement in received and
this in turn can affect the decision of user as to how to proceed.
make apparent a series of decisions showing cause and effect. this should
be non-digital and interactive (though you may use the computer to make
parts). This means the viewer may need to lift/open/turn/walk/touch in other
words ‘interact’ with your outcome in order for the decisions made to reveal
themselves. This does not have to be a polished product. it’s the idea that
is important. the decision that you explore could be trivial, practical,
philosophical etc. There of course may be one than one answer, after all life is complex.”